The Visual Language of Planning: Using Info Graphics to Transform Strategy
In the world of strategy and planning, ideas are often complex, interconnected, and full of moving parts. Communicating these concepts clearly, whether to a team, a client, or a stakeholder, is a challenge that can determine the success or failure of a project. This is where the power of Planning or Strategy Concept Info Graphics comes into play. These are not just decorative charts; they are structured visual frameworks designed to simplify complexity, reveal relationships, and guide action. From pie charts depicting resource allocation to flow diagrams outlining a new operational process, these graphics translate abstract strategy into concrete, understandable visual language.
From Abstract Thought to Concrete Action
The core purpose of any strategy graphic is to bridge the gap between thought and execution. A written plan can be dense and open to interpretation. A visual plan, however, imposes structure. Consider the difference between describing a departmental workflow in a paragraph versus illustrating it with a flow chart. The flow chart immediately shows sequence, decision points, dependencies, and endpoints. It makes bottlenecks visible and highlights redundant steps. This transformation from abstract description to concrete visual model is the first and most crucial advantage of integrating info graphics into your planning methodology.
The Toolkit: Charts for Every Strategic Need
Different planning challenges require different visual tools. Knowing which graphic to use is itself a strategic decision.
- Process & Flow Charts: These are indispensable for mapping workflows, customer journeys, or manufacturing sequences. They answer the question "How does this work?" and are fundamental for operational strategy.
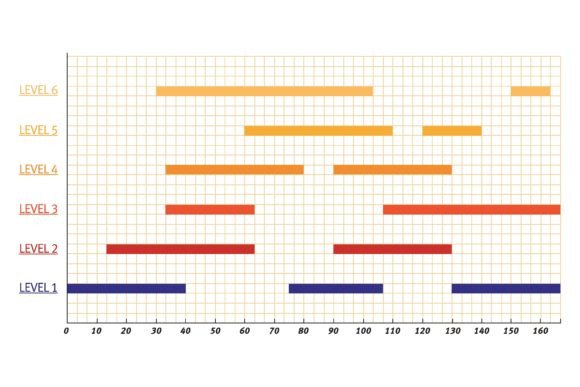
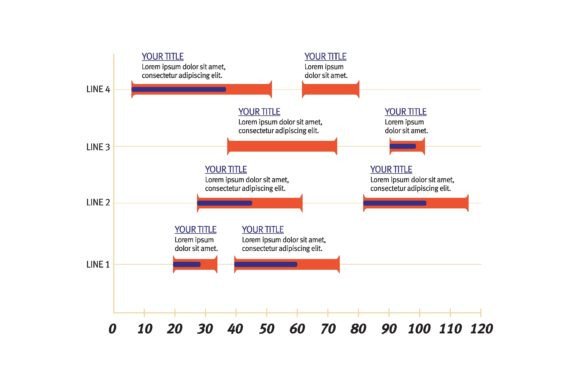
- Timeline Charts: For any plan with a temporal component—project milestones, product development phases, marketing campaign schedules—a timeline provides an unambiguous view of the schedule and critical deadlines.
- Cycle Diagrams: Strategies often involve recurring processes, like continuous improvement loops, sales cycles, or seasonal business activities. Cycle graphics emphasize the iterative, non-linear nature of these activities.
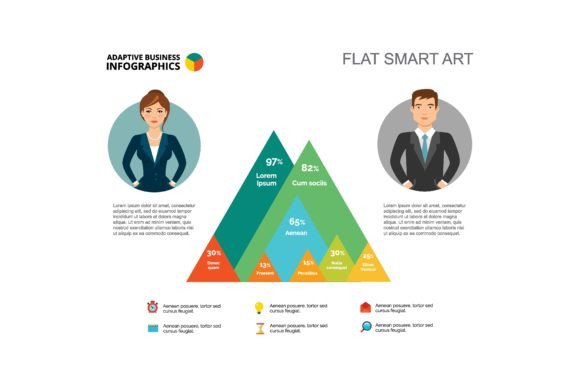
- Pie & Percentage Charts: When discussing budget allocation, market share, survey results, or resource distribution, these charts offer an immediate, intuitive sense of proportion and priority.
Each of these forms serves a specific function within the broader context of Planning or Strategy Concept Info Graphics. A comprehensive strategic report might employ a timeline for phases, a flow chart for a key process within a phase, and a pie chart to show budget split across those phases, creating a multi-layered visual narrative.
Real-World Applications Across Domains
The use of these graphics extends far beyond the boardroom. Their versatility makes them a universal tool for clarity.
In Communication & Persuasion
For presentations, brochures, and web design, strategy graphics are persuasive instruments. A well-designed infographic on a website explaining a company's sustainability strategy is more engaging and memorable than text alone. In a brochure for a financial service, a clear cycle diagram showing the investment process builds client trust and understanding. They reduce cognitive load on the audience, allowing the core message to be absorbed more quickly and retained longer.
In Internal Workflow & Management
Internally, these graphics become the blueprints for action. A process flow chart posted in a production facility standardizes procedures. A project timeline shared via a collaborative platform aligns every team member's efforts. They serve as constant, shared references that prevent misalignment and keep everyone moving toward the same strategic objectives. This application turns planning from a document into a dynamic, visual guidepost embedded in the daily workflow.
For Analysis & Reporting
In reports, whether for internal review or external stakeholders, graphics transform data into insight. A series of charts showing sales trends over time, broken down by region (timeline and pie charts combined), tells a story that raw numbers cannot. They highlight successes, pinpoint problems, and make recommendations visually compelling. This analytical use is critical for evaluating strategy effectiveness and making data-driven adjustments.
The Characteristics of Effective Strategy Graphics
Not all visuals are equally effective. A cluttered, poorly labeled chart can confuse more than it clarifies. Several key characteristics define a successful Planning or Strategy Concept Info Graphic.
First is simplicity. The graphic should distill complexity, not reproduce it. Every element must serve a purpose. Second is clarity of relationship. Arrows in a flow chart must indicate direction unambiguously; segments in a pie chart must be distinct. Third is consistent visual language. Using the same shape for similar steps across different diagrams, or a uniform color scheme for related themes, builds a cohesive visual strategy. Finally, effective graphics are action-oriented. They should point toward a decision, a next step, or a clear understanding of status. A timeline, for instance, isn't just a list of dates; it's a visual countdown to delivery that inherently drives action.
Considerations for Design and Implementation
Creating these tools requires thought. One must consider the audience's prior knowledge. A technical flow chart for engineers will differ from a high-level process cycle for consumers. The medium matters as well: a detailed flow chart might be perfect for a printed report but needs simplification for a mobile web design. Also, accuracy is paramount. A misleading percentage chart or an inaccurate timeline can derail strategy faster than a textual error. The graphic carries the authority of visual truth.
Furthermore, while software makes generating charts easy, the strategic thinking behind them is irreplaceable. Choosing what to include, what to highlight, and how to sequence information is a strategic act. The design of the info graphic should be guided by the same planning principles it aims to communicate.
Observing Trends in Strategic Visualization
The evolution of Planning or Strategy Concept Info Graphics reflects broader trends in business and technology. There is a move towards interactivity. Static charts in web design are giving way to interactive timelines where users can click to explore phases, or dynamic pie charts that update with new data. This turns the graphic from a snapshot into a living tool.
Another trend is integration. Graphics are no longer isolated elements but are embedded directly into collaborative planning platforms (like project management software), where the timeline chart is the actual project schedule interface, and the flow chart is the live workflow manager. This blurs the line between the plan's representation and its execution mechanism.
Finally, there is an increased emphasis on storytelling. A sequence of graphics—a timeline showing market evolution, followed by a flow chart of a new proposed response, concluded with a pie chart showing projected outcomes—creates a persuasive strategic narrative. This approach is particularly powerful for securing investment or aligning large organizations around a new direction.
Ultimately, the use of visual frameworks in planning is a recognition that humans are visual thinkers. A complex strategy can remain an intellectual exercise, confined to a few minds, until it is visualized. By employing the right chart at the right time—a process flow to define steps, a timeline to set pace, a cycle to show renewal, a pie chart to allocate resources—planners and strategists give their ideas form, share them with precision, and create the common visual ground necessary for collective action. Whether you are a business owner mapping a growth strategy, an educator designing a curriculum sequence, or a hobbyist planning a complex project, mastering this visual language is a practical step towards turning your plans into reality.