The Visual Language of Strategy: Translating Data into Action
The modern information landscape is a torrent of data. For professionals managing projects or steering marketing campaigns, raw numbers and lists of tasks can feel like a chaotic noise. The key to clarity, and therefore to effective action, lies in translation. This translation is the domain of information graphics—specifically, the strategic application of project and marketing concept info graphics. These are not mere decorations for reports; they are sophisticated visual tools that map workflows, communicate performance, and reveal hidden patterns, transforming abstract concepts into shared understanding.
Beyond Decoration: The Functional Core of Info Graphics
To understand their power, one must first strip away the notion that these graphics are simply about making a document "look nice." Their primary function is cognitive. A well-designed process flow diagram does more than show steps; it reveals dependencies, bottlenecks, and critical paths. A radar chart comparing multiple marketing channel performances isn't just a complex shape; it instantly highlights strengths and weaknesses across a unified set of criteria. When data is visualized, the brain processes relationships and proportions faster than it can parse text or spreadsheets. This shift from reading to seeing is fundamental to their utility in high-stakes environments.
The Anatomy of a Strategic Visual
Several core graphic types form the backbone of this visual language. Each serves a distinct purpose in clarifying project or marketing concepts.
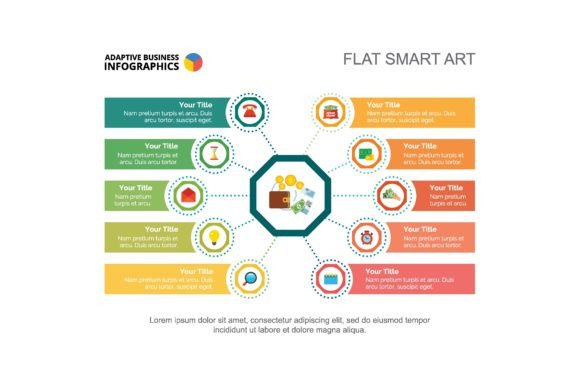
- Flow Charts and Process Diagrams: These are the blueprints of action. In a project workflow layout, they delineate each phase, decision point, and handoff. For a marketing campaign, they can map the customer journey from awareness to conversion, visually tying each touchpoint to a specific team's responsibility. The linear or branching structure makes complexity manageable.
- Radar Charts: Also known as spider charts, these are exceptional for comparative analysis. Imagine evaluating a product launch across multiple dimensions: market reach, cost efficiency, social engagement, customer satisfaction, and technical performance. Plotting each on a radar chart’s axis creates a polygon. The shape’s profile—whether it's balanced or spiked—immediately shows which areas are excelling and which are lagging, fostering a holistic view rather than a siloed metric review.
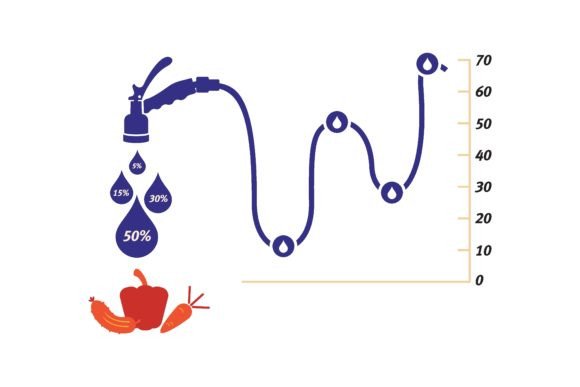
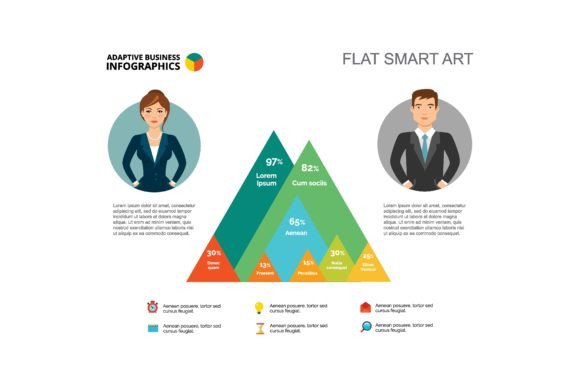
- Percentage and Proportional Graphics: From simple pie charts to more nuanced stacked bars, these visuals communicate allocation and share. In an annual report, they might show budget distribution across departments or the percentage of revenue stemming from different product lines. For a marketing concept, they could illustrate the demographic breakdown of a target audience or the contribution of various channels to overall lead generation. They answer the fundamental question: "How much of this is that?"
Concrete Applications in the Professional Realm
The theoretical value of these graphics becomes concrete in their application across standard business documents and active planning sessions.
The Annual Report as a Narrative Tool
An annual report is often a legal obligation, but it is also a primary communication tool for stakeholders. Using project info graphics here transforms a dry recitation of facts into a compelling narrative. A flow chart can summarize the company’s major strategic initiatives over the year, showing how R&D led to production, which led to marketing, and finally to sales. Radar charts can compare the company's performance against its own key targets or against industry benchmarks across several areas. Percentage graphics vividly depict growth, market share, or investment returns. This visual approach ensures the report is not only informative but also engaging and memorable, reinforcing transparency and strategic clarity.
Workflow Layouts for Operational Efficiency
In day-to-day operations, ambiguity is the enemy of efficiency. A detailed workflow layout, built using process diagrams, serves as a shared reference for a team or across departments. For a software development project, it might visualize the agile sprint cycle, showing stages from backlog grooming to deployment. For a content marketing team, it could outline the process from topic ideation, through writing, design, SEO review, and publishing. These visuals reduce misinterpretation, clarify handoff responsibilities, and can even be used to train new team members. They make the implicit, explicit.
Marketing Concept Visualization for Alignment
Marketing often deals with intangible concepts: brand positioning, audience personas, channel strategy. Info graphics give these concepts form. A flow chart can map the intended emotional journey of a customer in an ad campaign. Radar charts can be used to visually score and compare different creative campaign concepts against strategic objectives like "brand alignment," "virality potential," and "cost." Percentage-based infographics can show the planned mix of paid, owned, and earned media in a budget. Presenting a marketing plan through these visuals ensures that everyone—from the CMO to the graphic designer—is aligned on the same concrete vision, reducing conceptual drift.
The Human Advantage: From Data to Decision
The ultimate advantage of employing these graphics is their impact on human cognition and collaboration. A table of numbers requires individual, sequential analysis. A well-crafted infographic allows a group to simultaneously grasp a situation. This shared visual reference point in a meeting accelerates discussion; the team is debating the *same thing* they are all looking at. It minimizes the "I thought you meant..." problem. Furthermore, these graphics aid in memory retention. The shape of a radar chart or the flow of a process is more likely to be recalled later than a bulleted list, ensuring strategic decisions made in a planning session are not forgotten in execution.
Critical Considerations for Effective Implementation
Creating effective info graphics requires more than just technical skill with software; it demands strategic thought.
- Simplicity is Paramount: The goal is to simplify understanding, not to showcase graphical complexity. Avoid overloading a chart with too many data points or a flow diagram with excessive detail. Each visual should have a single, clear message.
- Consistency in Design: When used in a suite—like across an entire annual report—maintain consistent color schemes, fonts, and graphic styles. This creates a cohesive visual language that enhances professional credibility and reader comfort.
- Context and Explanation: A graphic should rarely stand alone. A brief title or accompanying paragraph should explain what it shows and why it’s relevant. The graphic and text should work in tandem.
- Audience Awareness: The choice of graphic type should suit the audience. A technical team might appreciate a detailed, multi-path flow chart, while a board of directors might need a high-level, percentage-based summary of annual growth.
- Truthfulness: The visual must accurately represent the underlying data. Distorting proportions or using misleading scales to make a point not only is unethical but will undermine trust in all future communications.
The Evolving Role in a Data-Driven Culture
As organizations continue to embrace data-driven decision-making, the role of project and marketing concept info graphics evolves from occasional reporting tool to integral component of the planning and review cycle. They are becoming the standard interface for translating raw analytics into actionable business intelligence. In brainstorming sessions, a blank flow chart template can be used to sketch out new project ideas. In quarterly reviews, radar charts tracking key performance indicators become the focal point for strategic adjustments. This integration signifies a maturation in their use: they are no longer just for reporting what happened, but for planning what will happen next.
The ability to distill complexity into clarity is a competitive advantage. In a world saturated with information, the skill to visually organize that information into coherent, actionable narratives—whether for a internal workflow, an external annual report, or a groundbreaking marketing concept—is not just a technical asset. It is a fundamental form of communication, bridging the gap between data and strategy, between concept and execution, and ultimately, between intention and result.