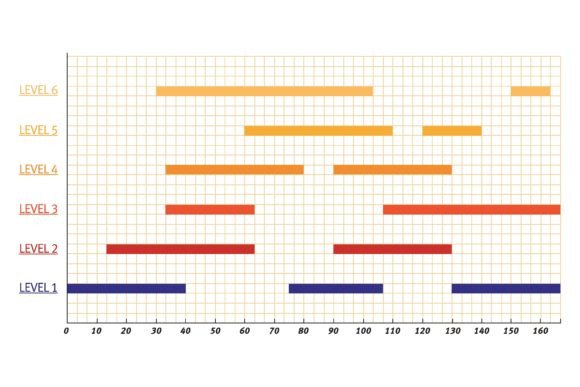
The Power of Visual Storytelling: Statistics and Planning Concept Info Graphics
In a world saturated with data and complex ideas, clarity is king. Whether you're presenting quarterly results, explaining a project timeline, or designing a website to attract clients, the ability to translate numbers and plans into compelling visuals is a game-changer. This is where Statistics or Planning Concept Info Graphics come into play. They are not just decorative elements; they are powerful communication tools designed to inform, persuade, and guide.
Beyond Basic Charts: The Scope of Info Graphics
When we think of info graphics, simple pie charts might come to mind. But the realm of Statistics or Planning Concept Info Graphics is vast and purpose-driven. It encompasses a toolkit of visual formats, each suited to tell a different part of the story.
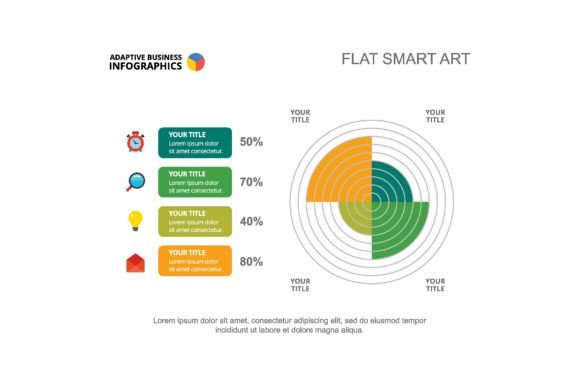
For raw statistics, you have the classics: bar charts for comparing quantities, line charts for tracking trends over time, and radial bar charts for showing data in a circular, often comparative layout. Then there are the nuanced specialists: percentage charts that instantly communicate share and proportion, perfect for brochures highlighting market penetration or survey results.
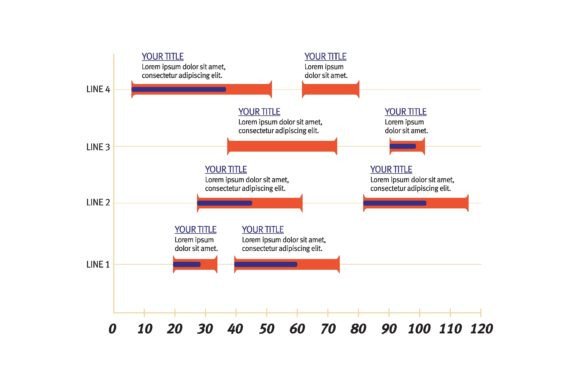
For planning and concepts, the visuals become more procedural. Process diagrams map out workflows, manufacturing stages, or customer journeys, turning abstract sequences into something you can follow. Schedule info graphics, like Gantt charts or timelines, are indispensable for project management, showing phases, dependencies, and milestones in a single, coherent view.
Where These Info Graphics Live and Work
The beauty of these tools is their adaptability. A well-designed Statistics or Planning Concept Info Graphic isn't confined to a single medium. It’s a versatile asset.
- Brochure Design: In a marketing brochure, a radial bar chart comparing your service features against competitors can be more convincing than paragraphs of text. A clean process info graphic can explain how your service works in three steps, easing a potential customer’s anxiety.
- Presentation: Slides thrive on clarity. Replacing a table of numbers with an animated line chart showing growth captivates an audience. A schedule info graphic in a project kickoff meeting sets clear expectations for the entire team.
- Web Design: On a website, these elements boost both SEO and user experience. An interactive percentage chart showing industry statistics can keep users engaged, while a process info graphic on a "How It Works" page improves comprehension and reduces bounce rates. Using semantically relevant alt text for these images, like "statistics info graphic on renewable energy adoption," helps search engines understand your content.
Why They Work: The Human Brain on Visuals
Our brains are wired for visual information. Processing an image is faster and often more memorable than parsing text or raw data. A Statistics or Planning Concept Info Graphic performs several critical functions:
- Simplification: It distills complexity. A 50-page report's key finding can become one impactful bar chart.
- Highlighting Relationships: It shows connections and comparisons that text might obscure. A line chart can reveal a correlation between marketing spend and sales that a table cannot.
- Creating Narrative: A sequence of process graphics tells a story—from problem to solution, from raw material to finished product.
- Enhancing Authority: Well-researched, cleanly presented data visuals build trust and credibility. They show you've done the work and can explain it.
In modern workflows, from agile project management dashboards to data-driven marketing strategies, these info graphics are the common language. They bridge the gap between data analysts and executives, between planners and field teams.
Practical Benefits for Your Project
Adopting Statistics or Planning Concept Info Graphics isn't just about aesthetics; it's about efficiency and impact.
Decision-Making Speed: A team can assess a project's status faster from a schedule info graphic than from a status report. Investors can grasp a startup's traction more quickly from a growth line chart.
Improved Communication: They reduce misunderstandings. When everyone sees the same process flow, assumptions are minimized. This is crucial in industries like software development, healthcare protocols, or construction planning.
Engagement and Retention: In a presentation or website, visuals break monotony. They give the viewer a "landing spot," increasing the chance they'll remember your key message. This is vital for educational content, training materials, and public awareness campaigns.
Choosing and Creating Effective Info Graphics
Before you rush to turn every data point into a chart, some considerations are essential. Not all data needs a graphic, and not every graphic type fits every purpose.
Start with Your Goal: What is the single most important thing you need to communicate? Is it a comparison (use a bar chart)? A trend (use a line chart)? A step-by-step procedure (use a process diagram)? Your goal dictates the form.
Consider Your Audience: A technical team might appreciate a detailed, complex schedule info graphic with all dependencies. A general public audience needs a simplified, high-level percentage chart with clear labels. Always design for the viewer's knowledge level.
Embrace Clarity, Resist Clutter: The best Statistics or Planning Concept Info Graphic is almost self-explanatory. Avoid excessive colors, ornate fonts, or too many data series in one chart. Use labels and titles directly. White space is not empty space; it's breathing room for the information.
Ensure Accuracy and Integrity: The visual is a vessel for the data. If the data is wrong or misleading, the graphic is harmful. Double-check your sources and calculations. Represent scales proportionally (a common pitfall in bar charts).
Examples in Action
Imagine a non-profit's annual report brochure. A percentage chart shows the breakdown of funding allocation (80% to programs, 15% to admin, 5% to fundraising). A line chart shows the increasing number of people served over five years. This instantly builds trust with donors.
Consider a software company's website. On the product page, a process info graphic with three icons illustrates "Upload," "Analyze," and "Report," demystifying the technology for a novice buyer.
In a construction firm's project proposal presentation, a detailed schedule info graphic (like a Gantt chart) outlines the six-month building timeline, with clear phases for foundation, framing, and finishing. This provides transparency and manages client expectations from day one.
The key is to let the Statistics or Planning Concept Info Graphic do the heavy lifting of explanation. Your supporting text then adds context and nuance, not basic understanding.
Integrating Info Graphics into Your Process
Making these visuals a regular part of your workflow requires a shift in thinking. Data and planning discussions should naturally lead to the question: "How can we visualize this?"
For recurring reports, standardize certain graphics for consistency. Your quarterly sales review might always feature the same line chart format, so readers know where to look. Use templates, but adapt them for the specific message of each project.
Tools range from sophisticated data visualization software to simpler online info graphic makers. The tool should match your skill level and the complexity of the graphic you need. Sometimes, a simple percentage chart created in a presentation tool is more effective and timely than a complex graphic requiring specialist design skills.
Remember, the ultimate aim is not to create a beautiful picture, but to create a clear conduit for information. A successful Statistics or Planning Concept Info Graphic is one where the viewer gets the point before they've even read the caption. It turns data into insight and plans into shared understanding, powering better decisions, clearer communication, and more effective storytelling in everything from a humble brochure to a major web design.