The Power of Information Graphics in Modern Workflow
Imagine presenting a complex annual report or a detailed project workflow. You have pages of dense statistics, intricate research concepts, and multi-step processes. The audience—whether they are executives, clients, or team members—glances at the document, and their eyes glaze over. This is where the strategic use of information graphics transforms communication. These aren't just decorative charts; they are essential design assets that make data comprehensible, memorable, and actionable.
Beyond Charts: What Makes an Infographic Work?
An effective information graphic is a cohesive visual story. It synthesizes data, research concepts, and narratives into a single, engaging layout. Its visual characteristics are defined by clarity and purpose. A successful infographic uses a consistent color palette, balanced typography, and a logical spatial arrangement to guide the viewer. Its personality can range from sleek and professional for an annual report to dynamic and colorful for a marketing campaign. The overall appeal lies in its ability to simplify complexity without sacrificing accuracy.
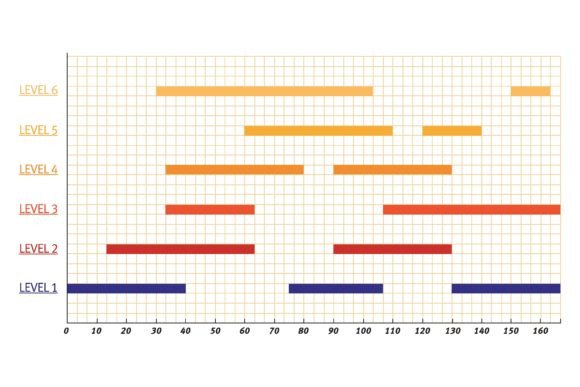
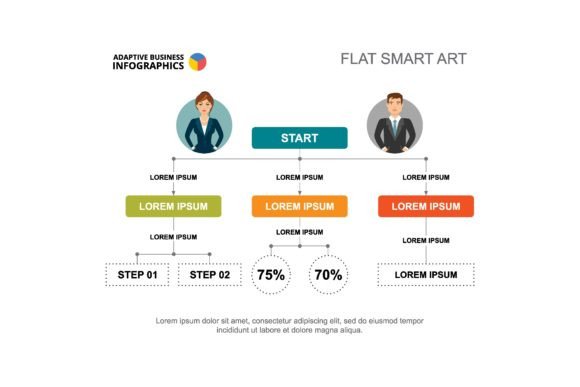
Common elements like bar charts compare values, pie charts show proportions, and flowcharts map processes. More specialized formats like radar charts compare multiple variables, radial bars offer a circular twist on standard data, and cycle diagrams illustrate recurring systems. Percentage visuals and process diagrams break down steps and milestones. When combined thoughtfully within a layout, these elements create a powerful hierarchy, directing attention to key insights first.
The Strategic Applications in Professional Projects
Information graphics are not confined to one medium or industry. Their versatility is their greatest strength. In branding and marketing, a well-crafted infographic can become a cornerstone piece of content, explaining a brand's unique value proposition or market research findings in a shareable format. For publishers and bloggers, they boost audience engagement by making articles and reports more digestible and visually appealing on digital platforms.
In a corporate setting, they are indispensable for annual reports. Instead of tables of financial data, a radial bar chart can show growth across departments over time, and a flow diagram can illustrate the company's operational structure. For entrepreneurs and small business owners, using process infographics in client proposals or internal workflows clarifies services and procedures, projecting professionalism and organization. Even crafters and hobbyists can use simple percentage or cycle graphics to explain project tutorials or plan creative processes on their blogs or social media channels.
Influencing Perception and Enhancing Communication
The impact of a professionally designed information graphic extends far beyond aesthetics. It directly influences readability by organizing scattered data into a logical visual path. This establishes a clear visual hierarchy, ensuring the most critical statistic or research concept is seen first. This hierarchy is a fundamental principle of modern typography and layout design.
From a brand perspective, consistent use of a specific style for your infographics—say, a minimalist approach with a particular sans serif font and a defined color scheme—builds recognition and reinforces brand identity. It signals consistency and attention to detail, elevating the perceived professionalism of your organization. For audience engagement, a compelling graphic is more likely to be read, understood, remembered, and shared, making it a vital tool for cutting through the noise in both print and web design.
A Practical Guide to Implementing Information Graphics
Choosing to use an infographic starts with evaluating the project's core need. Is the goal to compare, to explain a process, to show a distribution, or to track progress over time? Match the goal to the chart type: use bar charts for comparison, flowcharts for process, pie charts for distribution, and radar charts for multivariate analysis. Don't force a complex dataset into a simple pie chart if it misrepresents the information.
Testing the layout is crucial. Before finalizing, view the graphic at the size it will be used—whether on a mobile screen for social media graphics or in a large format print for an annual report. Check readability: are labels clear? Is the color contrast sufficient? Ensure the design assets you use, like icons and chart styles, pair well with your overall editorial or web design theme. For commercial projects, always verify the licensing of any premium fonts or template elements you incorporate to ensure they are cleared for commercial use.
Real-World Observations and Recommendations
In practice, I've seen a simple process infographic turn a 50-page operational manual into a single-page reference that teams actually use. I've seen an annual report shift from a dreaded document to a celebrated showcase of company achievements through the strategic use of radial bar charts and bold, clean typography. The key is to start with the data's truth and then seek the clearest, most honest way to visualize it.
Avoid the temptation to use every chart type in one graphic. Often, a single, well-executed bar chart with strong supporting annotations is more powerful than a crowded, multi-chart layout. For digital use, consider interactivity: can a web design element allow users to hover over a bar to see exact figures? For print, like packaging design or brochures, ensure the graphic stands alone without needing digital augmentation. Ultimately, your information graphic should serve its audience, making the complex simple and the mundane remarkable.