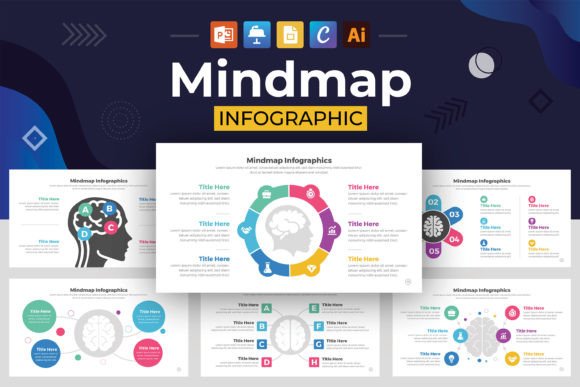
The Strategic Value of a Mindmap Infographic Design Layout
In a world saturated with information, the ability to clarify, connect, and communicate complex ideas is a competitive advantage. The Mindmap Infographic Design Layout represents a powerful fusion of two potent tools: the free-form, associative thinking of mind mapping and the structured, visual storytelling of an infographic. This hybrid approach transcends simple note-taking; it is a strategic framework for planning, problem-solving, and persuasion.
Beyond Brainstorming: A Tool for Strategic Clarity
Traditional mind mapping excels at capturing the organic flow of ideas around a central concept. However, when those ideas need to be presented to stakeholders, integrated into a project plan, or used as a foundation for a campaign, the raw map often lacks the polished, persuasive clarity required. A Mindmap Infographic Design Layout addresses this gap. It imposes a layer of intentional design—through hierarchy, color coding, iconography, and spatial organization—that transforms a personal brainstorming session into a professional, communicative asset.
This layout is strategically useful because it forces you to curate your thoughts. The process of designing the infographic compels you to identify which branches are core to your argument, which are supportive details, and which might be redundant. It moves you from discovery to decision-making, helping distill a storm of ideas into a clear strategic direction.
Key Use Cases for the Mindmap Infographic Layout
Adopting this approach is not about making diagrams prettier; it’s about enhancing functional outcomes in specific scenarios.
- Project Kickoffs & Proposals: Instead of a bullet-point list of project components, a mindmap infographic visually links objectives, deliverables, resources, and risks to the central project goal. This instantly shows interconnectedness and scope, aiding stakeholder understanding and buy-in.
- Content Strategy & Campaign Planning: Map out a central campaign theme with branches for target channels, key messages, content formats, and success metrics. The layout provides a holistic view, ensuring all elements align with the core strategy and revealing gaps or opportunities.
- Educational & Training Materials: For educators and trainers, converting a complex subject into a well-designed mindmap infographic aids comprehension and retention. It structures information logically while maintaining the contextual relationships between topics.
- Operational Process Mapping: Use it to visualize a workflow or customer journey. The central node is the process goal, with branches representing stages, responsible teams, tools used, and potential bottlenecks. This can reveal inefficiencies and improvement points more intuitively than a linear checklist.
- Personal Career or Business Planning: Entrepreneurs and freelancers can use it for strategic self-assessment. Place your business or career goal at the center, and map out branching strategies for skills development, marketing, service offerings, and financial planning.
Approaching the Design with Intentionality
The risk of any template, including Mindmap Infographic Templates, is unthinking application. Using a polished design without clear goals produces a visually appealing but strategically empty document. To avoid this, begin with the substance, not the style.
First, perform a traditional, rapid mind-mapping exercise to capture all relevant ideas, associations, and tasks related to your central topic. Do this on paper or a whiteboard without concern for design. Second, analyze this raw map. Identify the primary themes (these will become your main branches). Group related sub-ideas. Discard redundancies. This curation step is where strategic thinking is applied. Third, only then should you turn to a Mindmap Infographic Design Layout template.
The template’s value lies in its professional structure. It provides a clean canvas with designated areas for your curated branches, guiding you to arrange information hierarchically. Use its design elements—like color zones and icon sets—intentionally: assign colors to categories (e.g., all “risks” in red, all “resources” in green) and use icons to denote action types (e.g., a clock for timelines, a person for stakeholders). This coded visual language adds a layer of instant analysis for the viewer.
Strategic Considerations Before You Begin
A successful outcome depends on a few foundational decisions.
- Audience & Purpose First: Is this map for internal alignment, client presentation, or public education? The design emphasis will differ. Internal maps can be more detailed and action-oriented; client-facing maps should be cleaner and benefit-focused.
- Complexity vs. Clarity Trade-off: A mindmap infographic can become overcrowded. Be ruthless in prioritizing information. If a branch doesn’t directly support the core message or required action, consider removing it. The template aids clarity, but you must supply the discipline.
- Integration with Other Tools: View the Mindmap Infographic Design Layout not as a final product, but often as a strategic intermediary. It can be the blueprint that feeds into a project management tool, a presentation deck, or a written report. Its role is to organize thought before execution.
The Long-Term Value: Fostering Alignment and Creativity
Repeated use of this methodology cultivates better strategic habits. It encourages teams to start complex initiatives with a visual, holistic mapping session, fostering alignment from the outset. For individuals, it becomes a routine practice for breaking down ambitious goals into actionable, interconnected components.
Moreover, it systematically enhances creativity within structure. The initial mindmapping phase encourages free association and divergent thinking. The subsequent infographic design phase requires convergent thinking, synthesis, and logical ordering. This完整的 cycle captures the full creative problem-solving process, ensuring innovative ideas are not lost but are instead organized and made operational.
For marketers, educators, and business leaders, the output—the final designed infographic—serves as a persistent reference point. It can guide ongoing efforts, remind teams of the original strategy’s connections, and be easily updated as plans evolve. This creates a living document that maintains strategic coherence over the long term, rather than a static plan forgotten after creation.
Practical Tips for Effective Implementation
To move from concept to results, consider these actionable steps.
- Start Analog, Then Digital: Begin your ideation away from any software template to avoid design constraints stifling thought. Use pen and paper for the raw mind map.
- Leverage Template Flexibility: Choose a Mindmap Infographic Template that allows easy editing in tools you already use, like PowerPoint or Google Slides. The “100 Editable” and “using free fonts” features ensure you can adapt it to your brand without technical hurdles.
- Test for Comprehension: Before finalizing, show your designed layout to someone unfamiliar with the project. Can they grasp the central idea and the key relationships from the visual alone? This tests its communicative effectiveness.
- Iterate and Update: Treat the layout as a dynamic tool. As projects progress or strategies pivot, revisit and revise the infographic. This keeps the strategic vision current and communicated.
In conclusion, the Mindmap Infographic Design Layout is more than a template slide; it is a methodology for strategic thinking made visible. By intentionally merging the generative power of mind mapping with the communicative power of infographic design, it turns abstract ideas into concrete, actionable, and shareable visual strategies. For professionals aiming to clarify their direction, align their teams, and communicate complex plans with impact, mastering this hybrid tool is not just a design choice—it’s a strategic decision.