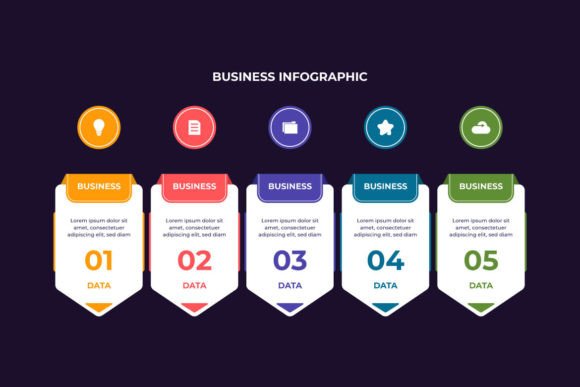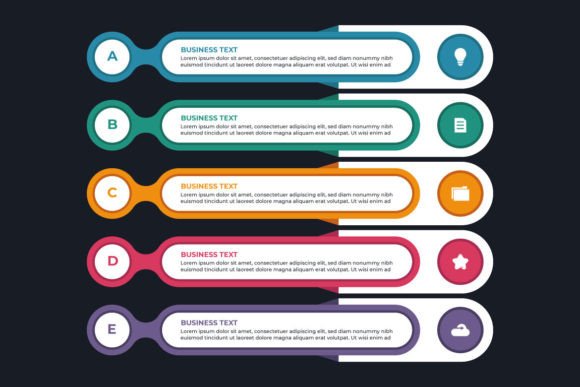
The Power of a Colorful List Infographic
In a world saturated with data, capturing attention and conveying complex information quickly is a constant challenge. A Colorful List Infographic is not just a pretty picture; it is a strategic tool for visual communication. It transforms mundane lists—of steps, features, milestones, or data points—into a compelling, organized, and memorable visual story. By employing color psychology, clear hierarchy, and engaging design, it turns abstract concepts into concrete understanding.
What Makes a Colorful List Infographic Effective?
The strength of this format lies in its deliberate simplicity paired with visual impact. Unlike dense reports or lengthy bullet-point documents, a Colorful List Infographic uses design principles to guide the viewer's eye and emphasize key messages. Its notable qualities are intentional.
First, color is used as a functional code, not merely decoration. Different hues can categorize information, indicate priority, show progression, or align with brand identity. A green item might signify a completed milestone, while orange highlights a current focus area. This visual coding reduces cognitive load, allowing the audience to grasp relationships instantly.
Second, it enforces clarity and scannability. A well-designed infographic presents items in a logical flow, often using numbers, icons, or spatial arrangement to denote sequence or grouping. This makes the information accessible to everyone, from a quick-glancing executive to a detail-oriented team member.
Finally, it bridges the gap between data and narrative. By visually plotting a strategic roadmap, for example, it tells the story of a business’s journey from inception to present. Each colorful milestone becomes a chapter, making the evolution of a company tangible and the strategic decisions that propelled it forward immediately apparent.
Practical Applications Across Fields
The utility of a Colorful List Infographic extends far beyond corporate boardrooms. Its adaptability makes it a valuable asset in numerous environments.
For Professionals and Businesses
Marketers can use it to distill a multi-channel campaign plan into a single, shareable visual for clients or internal teams. Entrepreneurs find it invaluable for pitching their startup's growth trajectory or key value propositions to investors—complexity is simplified into confidence. Business owners can map operational processes or safety protocols in a way that employees easily understand and remember.
In Education and Content Creation
Educators and trainers can break down intricate topics, like historical timelines or scientific procedures, into engaging learning aids. Bloggers and publishers leverage this format to create standout content that summarizes lengthy articles, compares products, or lists resources, dramatically increasing reader engagement and shareability on social platforms.
For Personal and Creative Projects
Freelancers showcase their service offerings or project steps in portfolios. Hobbyists might plan a complex craft project or travel itinerary visually. Even personal goals—like a fitness journey or a home renovation checklist—become more motivating and manageable when laid out in a vibrant, structured infographic.
The Tangible Benefits of Visual Lists
Adopting a Colorful List Infographic isn't about aesthetics alone; it's about measurable improvements in communication and outcome.
From a usability and efficiency standpoint, it accelerates comprehension. Meetings start with shared understanding, training time is reduced, and client approvals come faster. It also enhances communication and branding. A consistent, well-designed visual list reinforces brand identity through color and style, making every piece of communication feel cohesive and professional.
Most critically, it boosts engagement and retention. People are naturally drawn to color and order. Information presented in this format is more likely to be read, remembered, and acted upon. For internal teams, this can translate into higher adherence to processes. For external audiences, it leads to stronger message retention and a more positive perception of the sender's competence.
Real-World Use Cases and Observations
Consider a software company launching a new feature set. A textual press release might be ignored. A Colorful List Infographic highlighting "10 New Features," each with a distinct icon and color-coded by category (performance, security, usability), becomes the centerpiece of their announcement, used across websites, emails, and social media.
Another example is a nonprofit illustrating the steps of their impact model. A colorful, numbered list showing "From Donation to Community Change" makes their operational transparency compelling and trustworthy for donors.
An observation from the field: infographics that over-design or cram in too much text lose their core advantage. The most effective ones maintain a balance—each list item is concise, and the color scheme serves a clear, logical purpose.
Key Considerations for Implementation
When selecting or creating a Colorful List Infographic, a few practical guidelines ensure its success.
Start by auditing your information. Is it truly a list or sequence? Does it have natural categories or priorities? This format works best for structured, itemized content. Next, define your color logic. Choose a palette that is accessible (consider color blindness) and aligns with your purpose. Will colors represent stages, types, or urgency?
Pay close attention to hierarchy and flow. Use size, placement, and numbering to guide the viewer through the information in the correct order. Always remember the context of use. An infographic for a printed handout might differ from one designed for a mobile screen.
Finally, keep copy tight and support with visuals. Each list item should be a headline-summary, not a paragraph. Use simple, recognizable icons to reinforce the meaning of each point without clutter. The goal is to make the viewer’s journey through your information effortless and insightful.
In essence, a Colorful List Infographic is a bridge. It connects your detailed, often complex, internal knowledge to your audience's need for quick, clear, and engaging understanding. Whether you're unraveling the layers of a business's success, teaching a skill, or planning a project, it turns a list into a visual voyage that people are eager to embark on.