The Strategic Use of Financial Concept Infographics
In the dense world of finance, clarity is currency. A financial concept infographic transforms complex, abstract data—like timelines, cycles, and percentages—into a visual narrative that can be grasped in moments. This is not merely decorative; it is a strategic communication tool that bridges the gap between raw numbers and human understanding. For any professional tasked with explaining a financial report, illustrating a workflow, or designing a brochure, mastering this visual language is essential for influence and efficiency.
Why Visualizing Finance Is a Strategic Imperative
Financial data, in its tabular form, speaks to analysts. But stakeholders, team members, clients, and decision-makers often need the story behind the spreadsheet. A well-crafted financial concept infographic serves multiple strategic purposes. It accelerates comprehension, ensuring that key messages—such as growth timelines, investment cycles, or budget allocations—are not lost in a sea of digits. It enhances retention; people remember visual stories far longer than they remember isolated statistics. Most importantly, it drives alignment and decision-making. When everyone sees the same clear picture of a financial process or outcome, consensus and action follow more swiftly.
Turning Data into Decisions: Core Infographic Types
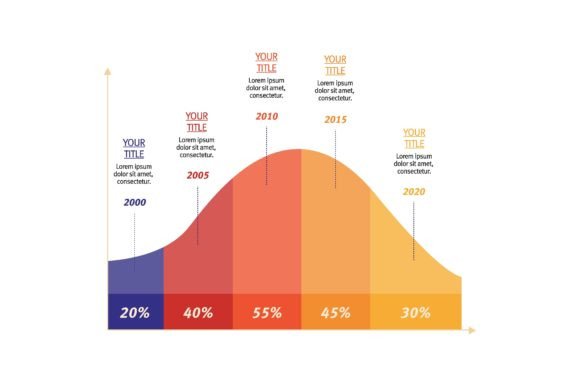
Three visual formats are particularly potent for financial communication. A timeline chart is invaluable for showcasing project milestones, funding rounds, or historical performance against forecasts. It provides a linear, cause-and-effect perspective that tables cannot. Cycle diagrams elegantly depict recurring processes like cash flow cycles, the stages of customer acquisition cost (CAC) recovery, or the circular workflow of quarterly financial reviews. They emphasize interconnection and continuity. Finally, percentage-based visuals (like pie charts or stacked bars) are crucial for breakdowns—market share, departmental cost allocation, or revenue composition. They answer the immediate question: “How is this pie divided?”
Intentional Use: From Random Decoration to Strategic Tool
The primary risk of using a financial concept infographic is applying it without a clear goal. A beautiful, but meaningless, cycle diagram in a brochure adds no value. Intentional use begins with a question: “What specific financial concept am I trying to clarify, and for whom?” Your audience dictates the design. A timeline for internal engineers might include technical budget phases; the same timeline for investors would highlight key return milestones. The infographic must serve the viewer’s need to make a better decision.
Before designing, consider the core message. Is it about progress (use a timeline), process (use a cycle), or proportion (use percentages)? Then, strip away all non-essential data. The strength of an infographic is simplification, not comprehensive detail. Reference the underlying report for granularity; let the visual provide the high-altitude view.
Practical Applications in Reports and Brochures
In a financial report, a summary page featuring a percentage breakdown of expenses can immediately direct leadership’s attention to cost drivers. A timeline showing the correlation between marketing investment spikes and sales revenue peaks offers instant strategic insight. For a workflow brochure design aimed at clients, a cycle diagram illustrating your service delivery process—from initial audit to final review—builds transparency and trust. It visually demystifies your financial operations.
- Report Example: Use a percentage infographic to compare actual vs. forecasted budget allocation, using color to highlight variances.
- Brochure Example: Employ a timeline chart to show client success stories, mapping their financial growth alongside your engagement periods.
- Planning Tip: Always start with a sketch. Map out the financial concept in its simplest form before any digital design begins.
Strategic Observations for Long-Term Value
A financial concept infographic is not a one-off task. Its thoughtful creation can become a template for ongoing communication. A well-designed cash flow cycle, for instance, can be updated and reused in monthly operational reviews, saving time and creating a consistent visual language within the organization. This consistency aids learning and branding; stakeholders become familiar with your visual framework, which reinforces your professionalism and clarity.
Furthermore, these visuals support better internal operations. A team that sees a clear timeline for a financial product launch understands interdependencies and deadlines more viscerally than from a Gantt chart alone. This visual alignment reduces miscommunication and accelerates productivity.
Risks and Considerations
While powerful, an infographic can also mislead if designed without context or ethical rigor. Simplifying a complex financial cycle might omit a critical risk phase, creating an illusion of safety. Over-emphasizing a positive percentage change with disproportionate graphics can distort the true scale of an achievement. Always ensure your visual abstraction does not become a distortion. Pair the infographic with accessible explanatory text or data sources. The goal is enlightened simplification, not manipulation.
Also, avoid the trap of choosing a visual format because it is trendy. The format must fit the financial concept, not the other way around. A complex, multi-factor decision process might not fit neatly into a cycle; a simple timeline might be more honest and effective.
Integrating Infographics into Your Communication Strategy
To use financial concept infographics intentionally, integrate them into your planning stage. When drafting a report outline or brochure content, identify the two or three key financial concepts that are most likely to confuse or most critical to understand. Flag these for visual treatment. Approach them as you would a key narrative point in a presentation: they require special clarity.
Think beyond a single document. Could this visual be used in a slide deck, an onboarding manual, or a client portal? Creating a versatile master version amplifies its value. Finally, test your infographic with someone unfamiliar with the underlying data. If they can accurately describe the financial concept after a brief look, your design is successful. If they stumble, refine it. The ultimate metric is not beauty, but understanding.
In a landscape saturated with data, the ability to distill a financial concept into a clear, strategic visual is a competitive advantage. It turns information into insight, and insight into informed action. By focusing on the goals of your audience and the essence of the concept, you elevate your communication from simple reporting to strategic influence.